

Rethinking Equity Exposure: The Macro Red Flags I Can’t Ignore

They say that time in the market is more important than timing the market.
While this might be true for large hedge funds (or if you are rich already), I don't believe this is necessarily true for retail investors.
I personally don’t see any reason to hold much equity at the moment.
This is a two-part article. In Part 1 I will first analyse the macro dynamics that make me hesitant to hold stocks. The fact that the market is obviously overpriced doesn’t mean one shouldn’t be ready when the opportunity to buy at reasonable prices arises: in Part 2 I will share my watchlist together with a short thesis for each stock.
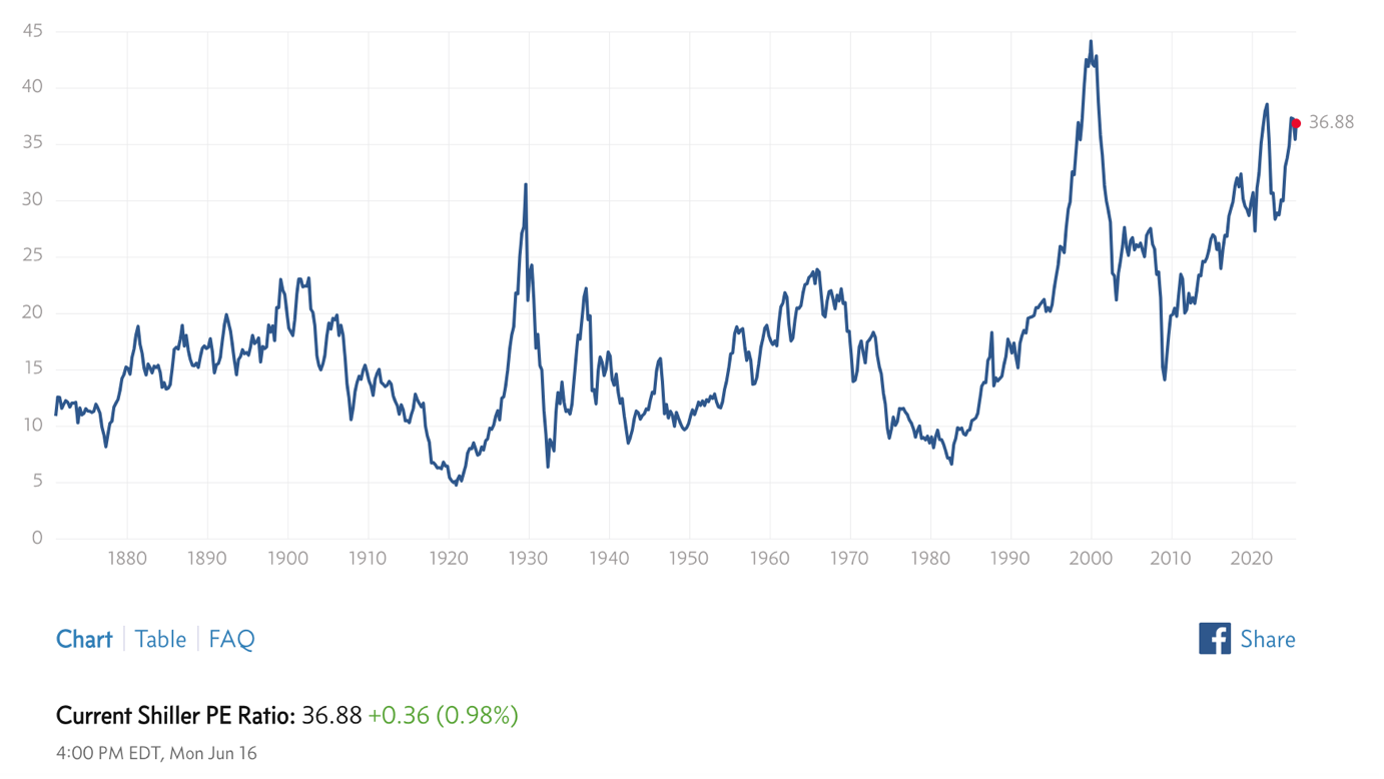
Case-Shiller close to dot-com bubble levels
The most widely used metric of stock market cheapness or expensiveness is the price-to-earnings ratio, albeit with variations in the earnings number that goes into the denominator on timing (current, last 12 months, or next 12 months), as well as share count (fully diluted vs. primary).
If you look at the Shiller graph of the (inflation-adjusted) P/E going back to 1880, the S&P 500 has only traded above the current reading of 36.88 for three years (1999, 2000, and 2021). The mean and median for the whole period dating back to 1880 are respectively 17.25 and 16.04.
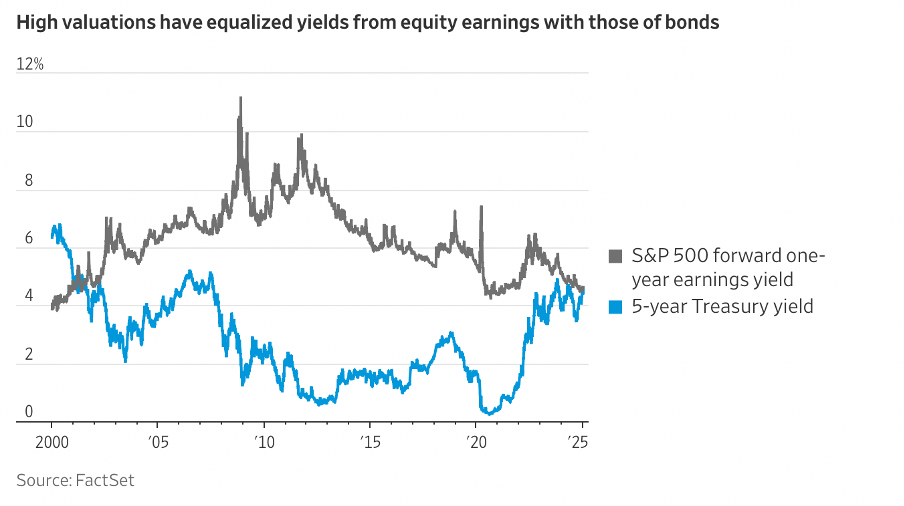
Even looking at the inverse of the P/E ratio (i.e. the earning yield), the expensiveness of this market could be justified up until a couple of years ago. In fact, if you compare the earnings yield to the ten-year treasury rate, you can see that for much of the last decade, going into 2022, the earnings yield, while low, was in excess of the ten-year rate. As rates have risen, though, the difference has narrowed, and at the start of 2025, the treasury rate exceeded the earnings yield.
Are these levels justified? In my opinion, and for the reasons that I have compiled in this short article, the answer is a resounding no.
Disconnect with FED balance sheet
The chart below illustrates the Total Assets of the Federal Reserve, which effectively represents the size of the Fed’s balance sheet, which expands and contracts based on its monetary policy actions, most notably Quantitative Easing (QE) and Quantitative Tightening (QT).
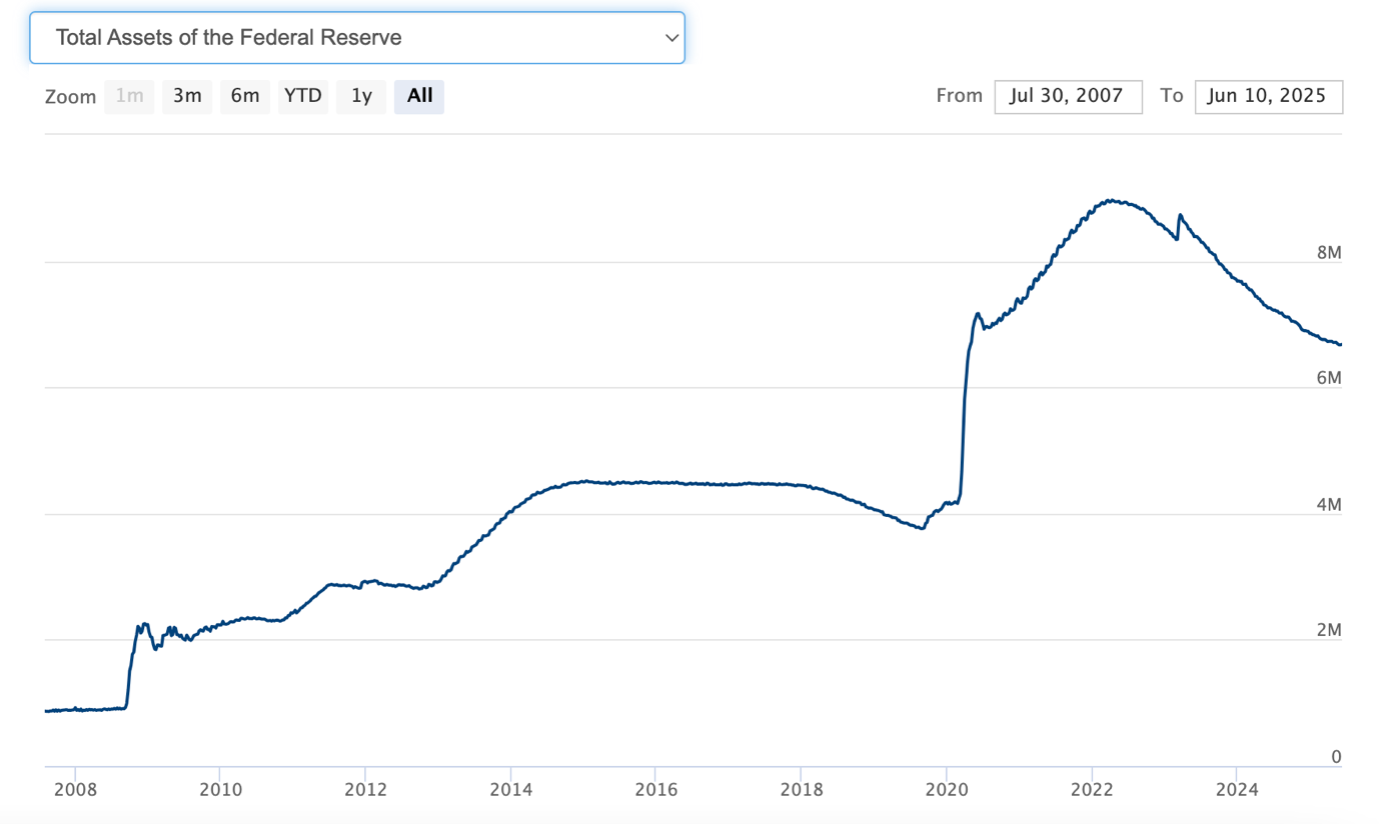
During periods of quantitative easing (QE) the FED buys treasuries and mortgage-backed securities (MBS), expanding its balance sheet and injecting liquidity into the market. This, theoretically, should lower interest rates and stimulate borrowing/investments. The Fed’s buying pressure drives up bond prices and pushes down yields, especially on long-term Treasuries.
On the contrary, during periods of quantitative tightening (QT) the FED lets securities mature without reinvestment (or sells them), contracting the balance sheet, and reducing liquidity to fight inflation. The Fed’s absence (or selling) removes a major buyer from the market, pushing yields up. Bond prices fall and yields rise.
QT should technically be bearish for equities, as rising rates reduce the present value of future earnings and puts pressure on riskier assets and place downward pressure on equity valuations.
Yet, the Shiller PE Ratio chart above shows a remarkably elevated valuation (36.88) – once again, well above historical norms and second only to the Dot-Com bubble.
So why are equity prices surging despite QT? A few possible explanations:
1. Expectation of Rate Cuts (Forward-Looking Markets)
Investors expect the Fed to pivot to cuts in the next 6–12 months due to disinflation and economic/job market softening.
2. Artificial Liquidity via Government Deficits
The U.S. government is running record deficits, financed by Treasury issuance.
Even with QT, the net liquidity effect may still be stimulative due to the Treasury General Account (TGA) being drawn down and Reverse Repo Facility (RRP) balances falling (i.e., cash re-entering the market).
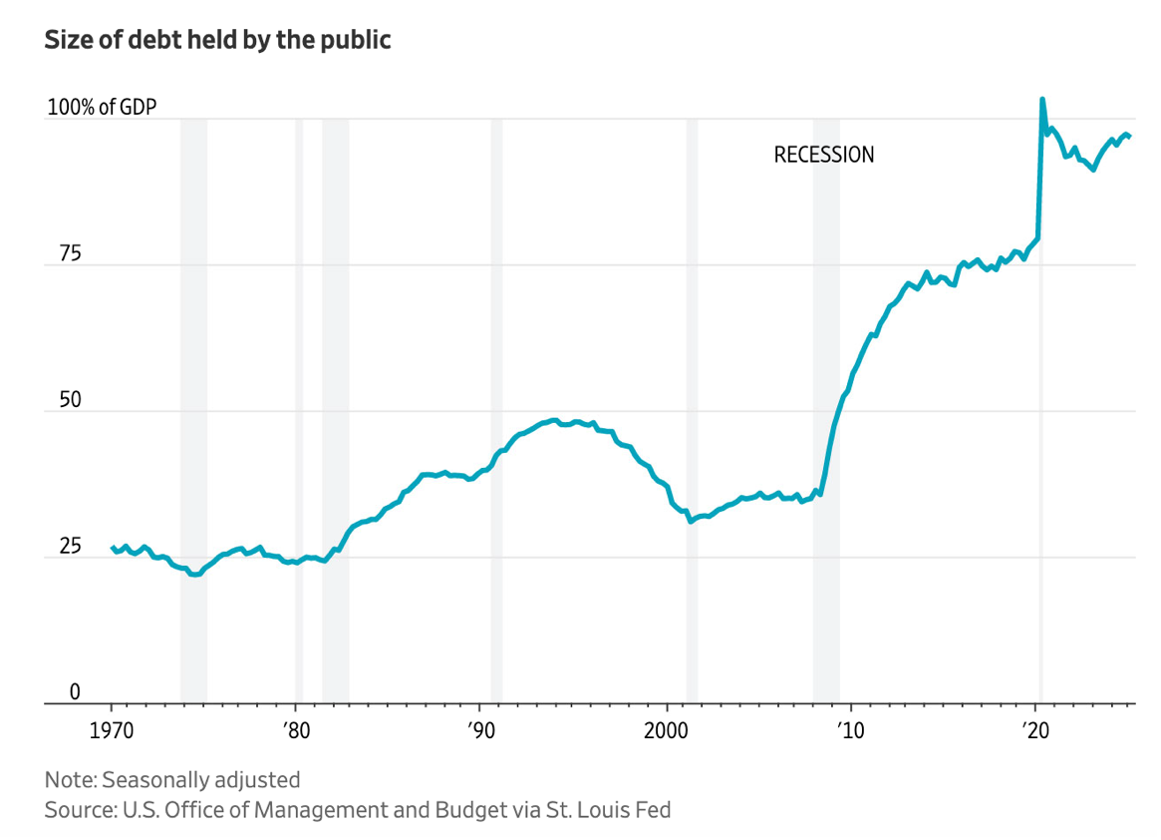
Since 2001, the federal government’s budget has run a deficit each year. Starting in 2016, increases in spending on social security, health care, and interest on federal debt have outpaced the growth of federal revenue. From FY 2019 to FY 2021, federal spending increased by about 50 percent in response to the COVID-19 pandemic. The last surplus for the federal government was in 2001.
Investors are accustomed to surging deficits during wars and recessions. Right now the government is borrowing as if it were in a crisis, even though it isn’t. That points to a structural fiscal imbalance that could require the government to keep issuing larger and larger amounts of notes and bonds.

Source: https://fiscaldata.treasury.gov/americas-finance-guide/national-deficit/

3. FOMO and Passive Flows
ETFs and retirement funds passively buy the index, regardless of valuation.
Retail participation surged again in 2024–2025, mirroring post-COVID behavior.
Momentum and narratives (e.g. AI boom) override fundamentals temporarily.
This divergence (high Shiller PE during QT) is not sustainable long term, but can persist longer than expected in the presence of narrative-driven liquidity, in this case driven by AI optimism. If inflation re-accelerates or the Fed delays cuts, markets may correct sharply.
Buffet Indicator
The Buffett Indicator (aka, Buffett Index, or Buffett Ratio) is the ratio of the total United States stock market to GDP. The Buffett Indicator expresses the value of the US stock market in terms of the size of the US economy. If the stock market value is growing much faster than the actual economy, then it may be in a bubble. The chart below shows how this number has never been so high as in present day.

In light of this, it is no surprise that Berkshire Hathaway (Buffett’s investment holding) has amassed the largest amount of cash and cash-equivalents in its history.
Trade wars and actual wars
At the time of writing, Iran and Israel are exchanging missiles left and right. While political leaders are calling for de-escalation, it is still unclear what position the US will take in the conflict. I will keep my political opinion aside for the purpose of this article. Nevertheless, and needless to say, any involvement by the US will further put strain on the stability of both the financial markets and the fiscal budget, with repercussions on many industries and sectors.
Even without the worst-case scenario, the longer the conflict runs, the more likely oil prices could add to inflationary pressures already building in the economy. That would give the Federal Reserve reason not to cut borrowing costs, while weighing on market sentiment.
While the war in the Middle East has recently overshadowed tariffs negotiations, the recent trade war between China and the US is still very much a concern for the markets, especially for the ramifications that prolonged friction on the tariff front can have.
China is the second-largest holder of U.S. treasuries. Some have speculated about whether China is behind the recent Treasury selloff, but there's little evidence of that. Currently, the opinion among analysts is that the selloff is driven primarily by hedge funds probably dumping their most liquid assets to meet margin calls, as well as being forced to unwind their so-called “basis trades”.
China could also use its currency and devalue the yuan (whose value is tightly controlled by the central bank) to help offset the impact of tariffs. A devaluation could rattle global markets and encourage other countries to follow, reducing the value of their own currency to help their exports remain competitive. A yuan devaluation would also likely anger the Trump administration, because it would boost the dollar's value.
Amid all this uncertainty, companies are freezing investments and hiring. The latter could put more pressure on the consumer, who is already showing signs of strain.
Cracks in consumer resilience
Economists largely agree that for the U.S. economy to slide into recession, the American consumer needs to falter.
Consumer spending is a major driver of the U.S. economy, typically accounting for roughly 68-70% of the nation's Gross Domestic Product (GDP). This means that the goods and services purchased by households and individuals significantly impact overall economic production and income.

As consumer spending fuels nearly 70% of U.S. GDP, any sustained pressure on household finances—such as rising borrowing costs—can ripple through the broader economy.
The yields on Treasurys set a baseline on borrowing costs across the economy because the U.S. government, for all its challenges, is still seen as the safest borrower around. The yield on the 10-year note, in particular, is a major determinant of 30-year mortgage rates.

High mortgage rates, coupled with higher maintenance and insurance costs have taken house affordability to levels last seen in 1985/86.

Finally, while Americans have been carrying bigger credit card balances, delinquency rates on consumer debt have been on the rise, raising fears that deteriorating finances for low-income borrowers could lead to a more pronounced slowdown in consumer spending.


AI investments might not bring benefit to justify the huge CAPEX
Bullish investors argue that Big Tech’s strong earnings growth and AI’s potential to spur productivity justify the lofty valuations of many of the world’s largest companies. Bearish commentators, meanwhile, draw comparisons between today’s market and the dotcom bubble that burst at the beginning of the millennium. Some even go back to 1929: with the advent of the automobile, the radio, the toaster, consumer payment plans, and branch banking, and advancements in communication systems, things felt drastically different back then.
Taken together, Apple, Microsoft, Google, Meta and Tesla invested nearly $280bn in artificial intelligence in 2024. For now companies have recorded massive investments in their balance sheets, but the much-touted benefits to the bottom line (both in terms of efficiencies and increased revenues) still have to materialize.
Ruchir Sharma writes that while “it is tough to imagine what could derail Big Tech firms, one answer is overspending on data centres and other AI infrastructure. One of the biggest capital spending booms that America has seen since the second world war may be great for the consumer, but could be the straw that finally breaks the supernormal profits of Big Tech companies and inspires investors to question their lofty valuations.”
US has grown to nearly two-thirds of global equity market value
US stocks’ huge surge since the global financial crisis means they account for almost two-thirds of the world’s investable market.
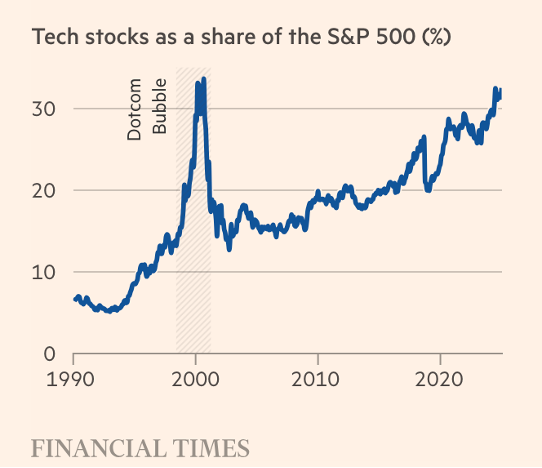
Wall Street has raced ahead of international rivals over the past decade and a half, driven largely by a rally in the tech sector (and particularly companies linked to artificial intelligence) which is now worth almost as much as all the stocks in Europe combined.
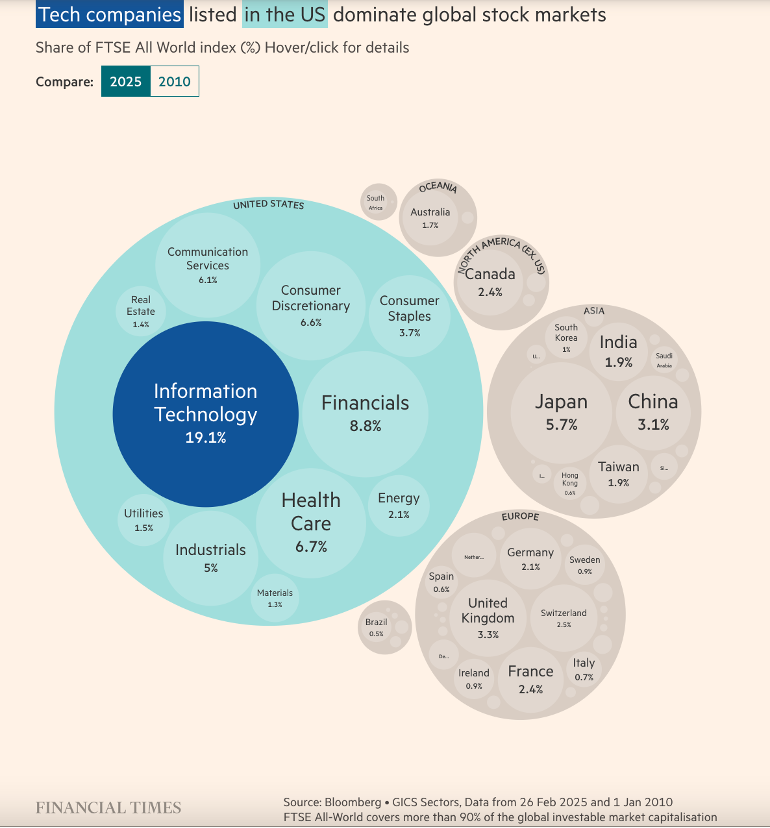
Effectively, if you hold a global tracker then by definition two-thirds of that is the US, and a lot of that is in Silicon Valley specifically, which means you’re very vulnerable to this huge bet on AI. Investing in a portfolio tracking a broad spread of global shares leaves you with too many eggs in one basket.
Conclusion
Part of being a good investor is knowing how to manage risk. For all the reasons outlined above, I don’t see the case for holding much equity right now. The limited potential upside doesn’t justify the much larger potential downside, as highlighted by the charts above.
While the old adage says that time in the market beats timing the market (statistically speaking), careful investors can’t just ignore the apparent red flags and sit on their hands. Or at least, I can’t.
That said, I firmly believe that times like these can offer the best opportunities for retail investors to pick quality stocks at more reasonable prices. In Part 2 of this article, I’ll share my current stock watchlist and thesis for the companies on my radar.
As always, I welcome contrarian views that can enrich my decision-making process.